Use consumer indifference curves and budget lines to illustrate the effects of an increase in income for a normal good and an inferior good (use two graphs). Be sure your diagrams are fully and correctly labeled.
What will be an ideal response?
The graphs should look like Figure 5-11 in the text for the normal good and Figure 5-12 for the inferior good. The graph for the inferior good should clearly show the consumption for one of the goods declining.
You might also like to view...
Use the figure below to answer the following question.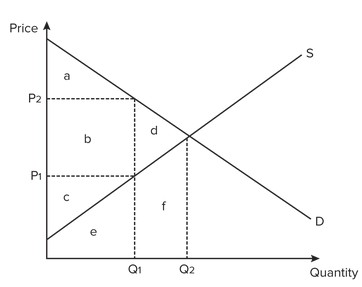 If actual production and consumption occur at Q2
A. there is deadweight loss of d. B. there is deadweight loss of f. C. consumer surplus and producer surplus is maximized. D. economic surplus is below the maximum.
Explain what a macroeconomic shock is, and give three examples of macroeconomic shocks to the U.S. economy in the past 10 years
What will be an ideal response?
Suppose that inventories were $40 billion in 2012 and $50 billion in 2013. In 2013, national income accountants would ________.
A. subtract $45 billion (= $90/2) from other elements of investment in calculating total investment B. add $45 billion (= $90/2) to other elements of investment in calculating total investment C. subtract $10 billion from other elements of investment in calculating total investment D. add $10 billion to other elements of investment in calculating total investment
The major source of new scientific knowledge in the United States is:
A. university and government research. B. R&D work in large corporations. C. entrepreneurs working alone. D. purely competitive and monopolistically competitive firms.