First, create a scatter plot for the data in the table. Then, use the shape of the scatter plot given to determine if the data are best modeled by a linear function, an exponential function, a logarithmic function, or a quadratic function.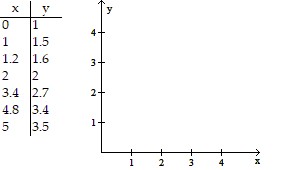
A. 
quadratic function
B. 
exponential function
C. 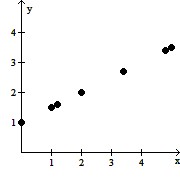
linear function
D. 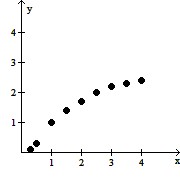
logarithmic function
Answer: C
Mathematics
You might also like to view...
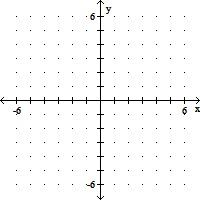
Graph the function as a solid line or curve and its inverse as a dashed line or curve on the same axes.f(x) = -2x + 1
A. 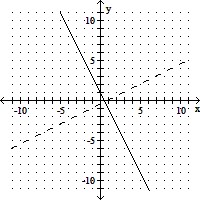
B. 
C. 
D. 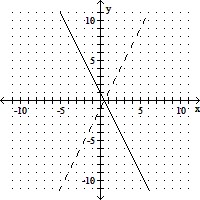
Mathematics
Use the square root property to solve the equation.  2 =
2 = 
A. 
B. -  ,
, 
C. 
D. 
Mathematics
Graph the function using a calculator and point-by-point plotting. Indicate increasing and decreasing intervals.f(x) = 2 - ln(x + 4)
A. Decreasing: (4, ?)
B. Decreasing: (-4, ?)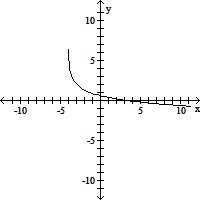
C. Decreasing: (0, ?)
D. Decreasing: (-4, ?)
Mathematics
Graph the function.f(x) = 
A. 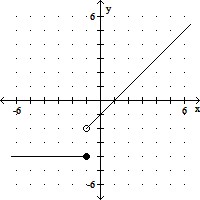
B. 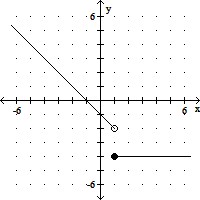
C. 
D. 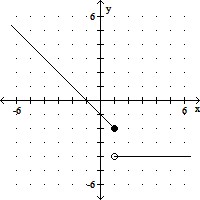
Mathematics