The line graph shows the recorded hourly temperatures in degrees Fahrenheit at an airport. Use the graph to answer the question.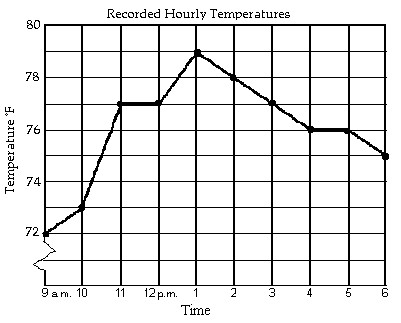 At what time was the temperature the lowest?
A. 10 a.m.
B. 1 p.m.
C. 9 a.m.
D. 6 p.m.
Answer: C
You might also like to view...
State whether you think that the variables have strong positive correlation, weak positive correlation, strong negative correlation, weak negative correlation, or no correlation.Actual temperature on a given day and the temperature that had been forecast for that day 10 days previously.
A. Strong negative correlation B. No correlation C. Weak positive correlation D. Strong positive correlation E. Weak negative correlation
Decide if the sets are equivalent to one another.{a, b, c, d} and {A, B, C, D}
A. Equivalent B. Not equivalent
Provide an appropriate response. and
and  __________.
A. coincide B. intersect C. are perpendicular D. are parallel
Find the length of the arc intercepted by the given central angle ? in a circle of radius r.? =  , r = 0.399 mm
A. 0.235 mm B. 0.075 mm C. 6.685 mm D. 2.128 mm