Exhibit 15-1 Production possibilities curves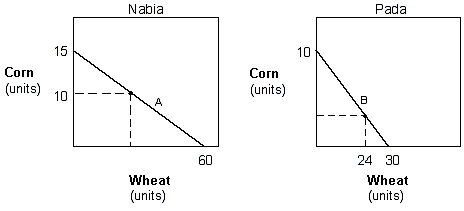
In Exhibit 15-1, the production possibilities curves of wheat and corn for Nabia and Pada are presented. Suppose Nabia produces at point A on its PPC. How many units of wheat is the country able to produce?
A. 15.
B. 60.
C. 40.
D. 20.
Answer: D
You might also like to view...
A specified maximum amount of the good that may be imported in a given period of time is a
A) dumping limit. B) tariff. C) quota. D) sanction. E) forcible limit.
What will happen to the annual rate of growth of per capita real GDP if real GDP grows at a constant rate of 4.5 percent and the annual rate of population growth goes from 3 percent to 3.5 percent?
A) The annual rate of growth of per capita real GDP will increase from 7.5 percent to 8 percent. B) The annual rate of growth of per capita real GDP will increase from -1.5 percent to -1 percent. C) The annual rate of growth of per capita real GDP will remain unchanged. D) The annual rate of growth of per capita real GDP will decrease from 1.5 percent to 1 percent.
The more elastic the supply curve, the ____ will be the effect of a tax on the quantity exchanged and the ____ will be the welfare cost. a. greater; greater
b. greater; smaller. c. smaller; greater. d. smaller; smaller.
The majority of federal expenditures is spent on
A. Public sector purchases of goods and services. B. National Defense. C. Private sector purchases of goods and services. D. Income transfers.