From the following data, construct the type of graph indicated.The following table shows the percent of 12th graders who smoked cigarettes daily at various times from 1995 - 2014 in Country A. Plot a broken-line graph illustrating these numbers.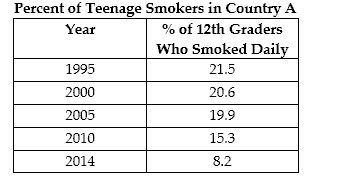
What will be an ideal response?

Mathematics
You might also like to view...
Find the GCF for the list.10x, 5
A. 1 B. 2x C. 5 D. 10x
Mathematics
Factor by grouping.xy + y + 9x + 9
A. (x + 9)(y + 1) B. (x + 1)(y + 9) C. (9x + 9)(y + 1) D. (x + 1)(9y + 9)
Mathematics
Simplify.i37
A. -i B. 1 C. i D. -1
Mathematics
Evaluate as instructed.Evaluate (f/g)(-2).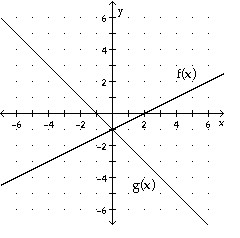
A. - 2
B. - 
C. 2
D. - 3
Mathematics