The line graph shows the recorded hourly temperatures in degrees Fahrenheit at an airport. 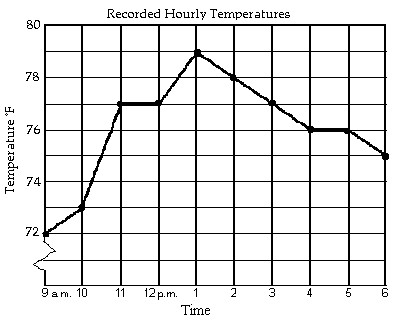 During which hour did the temperature increase the most?
A. 1 p.m. to 2 p.m.
B. 9 a.m. to 10 a.m.
C. 10 a.m. to 11 a.m.
D. 12 p.m. to 1 p.m.
Answer: C
You might also like to view...
Graph the solution set of the system of linear inequalities. If the system has no solutions, state this.

A. 
B. 
C. 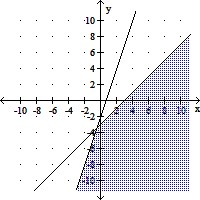
D. 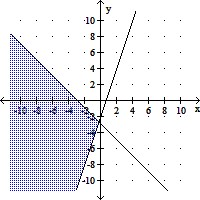
Convert the base-ten number to a number in the indicated base.329 to base six
A. 1305six B. 1350six C. 1530six D. 135six
This frequency table gives the distribution of ages of 100 people in a small town. 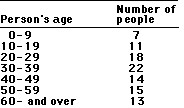 How many people are:30 years of age or older but less than 40 years of age
A. 64 B. 18 C. 36 D. 22
Solve.Jim has a 3-year car lease that allows him to buy the car at the end of the lease for  plus 14 cents a mile for each mile the car is driven over 30,000 miles. If at the end of the lease the mileage on Jim's car is 34,500.5 miles, how much will it cost Jim to buy the car?
A. $689.07 B. $68,907 C. $6530.07 D. $653,007