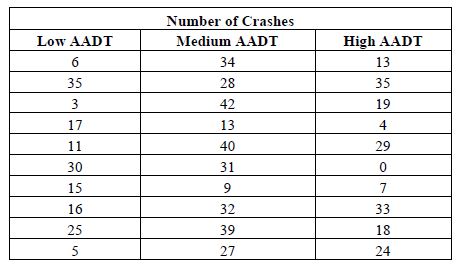
The numbers of crashes occurring for over a period of three years for different levels (high, medium, low) of AADT at unsignalized rural intersections are given in the table below. Using the Kruskal-Wallis H test determine whether it can be concluded that the distribution of crashes at unsignalized rural intersections is the same for all AADT levels. Use a significance level of 5 percent.
What will be an ideal response?
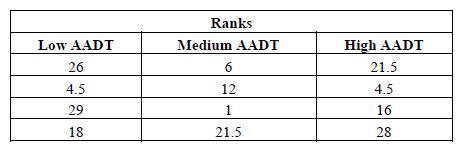
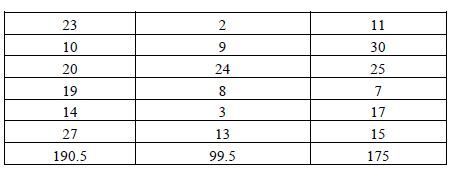
a) Rank the number of crashes as shown in Table below.
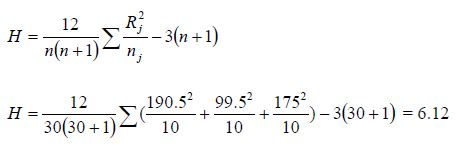
b) Determine the statistic H using Eq.5.84
c) Determine whether we should accept or reject the null hypothesis
Degrees of freedom = (3 – 1) = 2
? = 0.05
From the ?2 table in Appendix A, we obtain ?20.05,2 =5.991 < H = 6.12
Hence, it cannot be concluded that the distribution of crashes at unsignalized rural
intersections is the same for all AADT levels.
You might also like to view...
Judy hired some men to plant her soybean crop. How much of her soybean crop remains to be planted if John planted 1/3, Kenny planted 2/7, and Joe planted 1/8?
What will be an ideal response?
The spring-loaded type of relief valve is normally brass with a(n) ____________________ seat.
Fill in the blank(s) with the appropriate word(s).
When a BJT amplifier is saturated, VCE is about ________ and IC is ________
A) zero, minimum B) zero, maximum C) 25 V, 10 mA D) VCC, minimum
Backlash is the clearance between two gears in mesh.
Answer the following statement true (T) or false (F)