Use the information given to draw a bar graph. Clearly label the bars. The following table shows the number of inches of rainfall measured at City X during various days. Make a vertical bar graph to illustrate the data.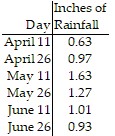
What will be an ideal response?
Answers may vary. The following is a possible answer.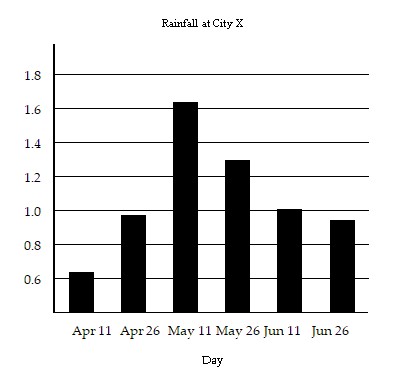
Mathematics
You might also like to view...
Divide. Simplify, if possible. ÷
÷ 
A. 280
B. 
C. 10
D. 
Mathematics
Shade the portion of the diagram that represents the given set. ?
? 

A. 
B. 
Mathematics
Use the formula d = rt to find the value of the missing variable.d = 770 miles, r = 70 mph
A. t = 12 hr B. t = 84 hr C. t = 11 hr D. t = 539 hr
Mathematics
List the intercepts for the graph of the equation.4x2 + y2 = 4
A. (-2, 0), (0, -1), (0, 1), (2, 0) B. (-1, 0), (0, -4), (0, 4), (1, 0) C. (-4, 0), (0, -1), (0, 1), (4, 0) D. (-1, 0), (0, -2), (0, 2), (1, 0)
Mathematics