Refer to the information provided in Figure 24.1 below to answer the question(s) that follow.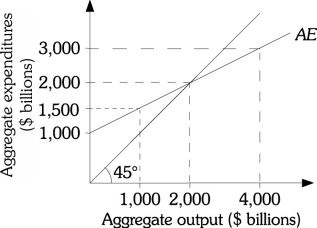 Figure 24.1Refer to Figure 24.1. Suppose that the consumption function is C = 400 + 0.5Yd and taxes are $200 billion, at equilibrium, what is the value of consumption?
A. $2,000
B. $1,350
C. $1,300
D. $1,150
Answer: C
You might also like to view...
The estimated slope coefficient (b) of the regression equation (Ln Y = a + b Ln X) measures the ____ change in Y for a one ____ change in X
a. percentage, unit b. percentage, percent c. unit, unit d. unit, percent e. none of the above
Which of the following does the production possibilities curve illustrate?
a. The tradeoffs facing a society b. The fact that more of one product can be produced only by reducing the quantity of other products that are being produced, assuming that resources are being used efficiently c. The maximum output that can be produced with a limited amount of resources d. The opportunity cost of alternative choices e. All of these
Mauritius, an island off the coast of Africa, competes with other countries producing goods with low-skilled labor. In 2006, it was reported that its "...factories have been exposed to ... competition from China, India, and other Asian mass producers." As a result, "the main export industry has seen a 30% reduction in volume..." The story describes:
a) a decrease in autonomous expenditure b) a decrease in induced expenditure c) an unplanned decrease in inventories d) an increase in equilibrium expenditure
Suppose the economy had been producing at potential output but is now experiencing a recession. Which of the following are discretionary fiscal policies that could bring the economy closer to potential output? Check all that apply.
A. Raising interest rates B. A tax increase C. Additional spending on national park facilities D. A tax cut