Figure 10-1
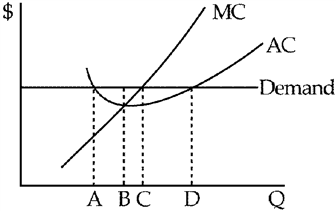
If the profit-maximizing firm depicted in Figure 10-1 is perfectly competitive, how much output should it produce?
a.
A
b.
B
c.
C
d.
D
c
You might also like to view...
The economy pictured in the figure below has a(n) ________ gap with a short-run equilibrium combination of inflation and output indicated by point ________. 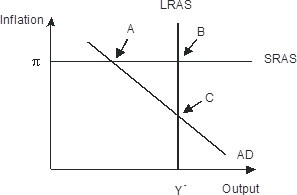
A. recessionary; B B. recessionary; C C. recessionary; A D. expansionary; A
The main explanation for why the cheap foreign labor argument is a poor reason for restricting international trade is that:
a. workers who get paid less tend to have lower productivity than those who get paid more. b. all firms and workers gain when there are no restrictions on international trade. c. infant industries such as steel and automobiles need to be protected. d. specialization and free trade usually raise the prices of all the traded goods, so that the workers can get paid more. e. labor costs tend to be the same worldwide in the long run because of worker mobility.
Suppose a $30 billion increase in government purchases increased GDP by $120 billion, what is the value of the MPC?
a. 4.00 b. 0.75 c. 0.25 d. 0.50 e. 0.33
The Lorenz curve shows the distribution of
A. wealth. B. income. C. poverty. D. jobs.