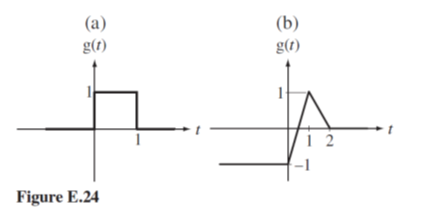
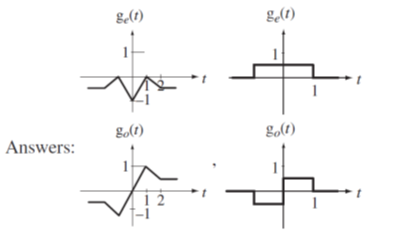
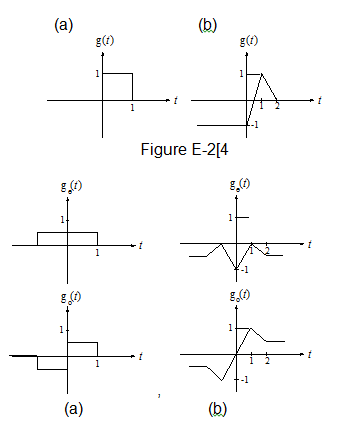
Graph the even and odd parts of the functions in Figure E.24.
Solution :
To graph the even part of graphically-defined functions like these, first graph g(t). Then add it (graphically, point by point) to g(t) and (graphically) divide the sum by two. Then, to graph the odd part, subtract g(-t) from g(t) (graphically) and divide the difference by two.
You might also like to view...
Automation has allowed manufacturers to increase productivity and cut costs, which makes their products more competitively priced.
Answer the following statement true (T) or false (F)
Coal releases a poisonous gas called sulfur dioxide as it burns
Indicate whether the statement is true or false
The vast majority of ammonia in the atmosphere is returned to the surface predominantly in ____________________
Fill in the blank(s) with correct word
All inorganic material comes from nonliving sources and does not contain carbon
Indicate whether the statement is true or false