Figure 7-2
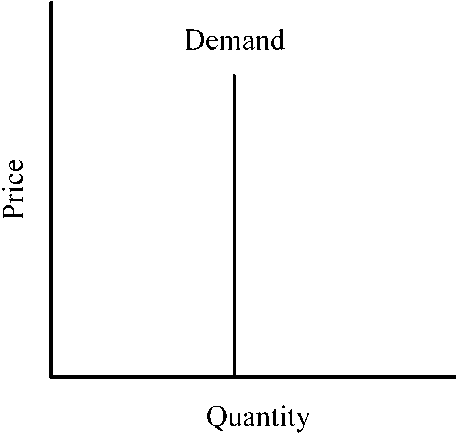
depicts a demand curve with a price elasticity that is
a.
perfectly elastic, implying that as much as can be supplied will be purchased at the market price.
b.
relatively inelastic, implying that a percent increase in price results in a smaller percent reduction in sales.
c.
unitary, implying that a percent change in price leads to an equal percent change in quantity demanded.
d.
perfectly inelastic, implying that the same amount will be purchased regardless of the price of the good.
d
You might also like to view...
Conditional input demands are homogeneous of degree zero in input prices.
Answer the following statement true (T) or false (F)
Putting a decision into action is called?
a. Visualization b. Implementation c. Satisficing d. Reactivity
Finding an apartment in New York City is difficult. People even scan the obituaries in the hopes of finding an apartment. Provide an economic explanation for this
What will be an ideal response?
Among the components of each NPDWR is
a. the minimum contaminant level b. a secondary maximum contaminant level to protect public welfare c. a National Contaminant Occurrence Database (NCOD) d. the maximum contaminant level goal (MCLG)