According to the graph shown, if this economy were to open to trade, domestic producers would:
This graph demonstrates the domestic demand and supply for a good, as well as the world price for that good.
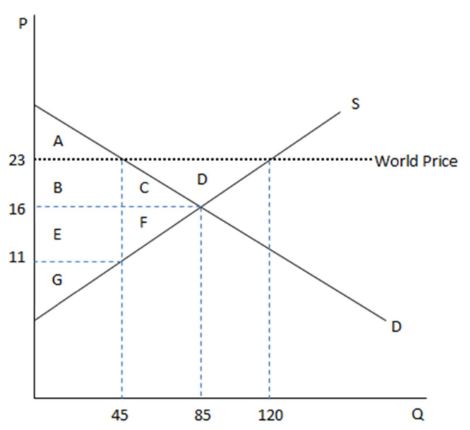
A. transfer surplus in area BC to consumers.
B. transfer surplus in area BCD to foreign producers.
C. lose surplus in area BCD to foreign consumers.
D. receive additional surplus of BCD.
D. receive additional surplus of BCD.
You might also like to view...
The data in the table above shows the consumption by families in a small (poor) economy. The families consume only salt and bread. The reference base period is 2011. The CPI in 2012 is
A) 118.8 B) 123.1 C) 100. D) 18.8 E) 23.1
Producer surplus is the ________ summed over the quantity produced
A) price of the good minus the marginal cost of producing it B) marginal benefit of the good minus its marginal cost C) marginal benefit of the good minus its price D) marginal cost of the good minus the opportunity cost of producing it E) None of the above answers is correct.
Refer to Figure 4-10. Suppose that instead of a price ceiling, the government imposed a price floor of R1. What is the quantity of apartments demanded at the new price?
A) Q1 B) 0 C) Q0 D) Q*
Which of the following asserts that expanding all inputs proportionately does not change the average cost of production?
a. Constant returns to scale b. Diseconomies of scale c. Long-run implicit costs d. Economies of scale