In the figure above, point D is
A) less production efficient than point C.
B) production efficient and point A is not production efficient.
C) not production efficient and point B is production efficient.
D) production efficient and point B is not production efficient.
B
You might also like to view...
The willingness to pay of buyers' in a market:
A. is represented by the demand curve. B. is represented by the supply curve. C. explains why the demand curve is bowed-out. D. explains why the demand curve is bowed-in.
Assuming the economy represented in the graph shown is currently at point B, if the government does nothing, then eventually:
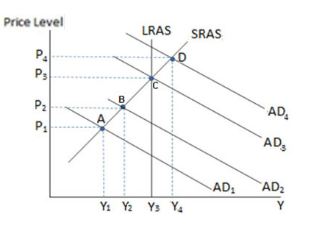
A. SRAS will shift to the right, and the economy will have Y3 output with lower prices.
B. SRAS will shift left, and the economy will experience stagflation.
C. LRAS will shift left, until lower equilibrium output is reached with lower prices.
D. the entire economy will collapse.
Refer to the accompanying figure.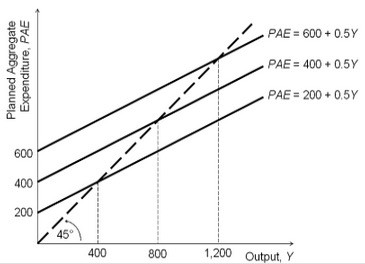 Based on the figure, the income-expenditure multiplier equals:
A. 0.5. B. 2. C. 200. D. 5.
The theory of purchasing power parity:
A. contradicts the law of one price. B. extends the law of one price to a basket of goods. C. explains exchange rate movements in the short run, while the law of one price explains exchange rate movements over the long run. D. assumes away inflation to have any validity.