Solve the problem.The following data represents the normal monthly precipitation for a certain city in California. 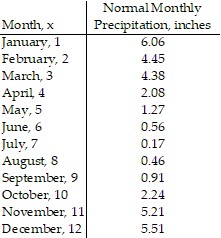 Draw a scatter diagram of the data for one period. Find a sinusoidal function of the form
  that fits the data. Draw the sinusoidal function on the scatter diagram. Use a graphing utility to find the sinusoidal function of best fit. Draw the sinusoidal function of best fit on the scatter diagram.
What will be an ideal response?
y = 3.14 sin (0.46x + 1.52) + 3.16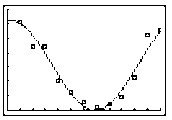
Mathematics
You might also like to view...
Describe the solution set as an inequality and in interval notation. |x| > -4
A. 4 B. -4 < x < 4; (-4, 4) C. empty set D. the set of real numbers; (-?, ?)
Mathematics
Find the average rate of change for f(x) on the given interval.f(x) = (x - 8)2 - 81, [1, 20]
A. 11 B. 5 C. -11 D. -5
Mathematics
Solve the problem.In a manufacturing process, three quantities p, r, and s are related by the equation  Find p when
  and s = 288. Give your answer as a simplified radical.
A. 
B. 
C. 
D. 
Mathematics
Solve the problem.A tree casts a shadow of 26 meters when the angle of elevation of the sun is 24°. Find the height of the tree to the nearest meter.
A. 13 m B. 12 m C. 10 m D. 11 m
Mathematics