Refer to the below table. If the price of X decreases to $2, then the utility-maximizing combination of the two products is:
The table below shows the total utility data for products X and Y. Assume that the prices of X and Y are $3 and $4, respectively, and that consumer income is $18.
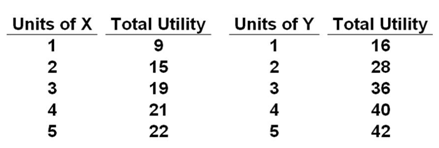
A. 2 of X and 2 of Y
B. 2 of X and 3 of Y
C. 3 of X and 3 of Y
D. 4 of X and 4 of Y
C. 3 of X and 3 of Y
You might also like to view...
A curve that shows the cost to the firm of hiring an additional unit of a resource is known as a
a. marginal product curve b. marginal revenue product curve c. total revenue product curve d. marginal revenue curve e. marginal resource cost curve
Which of the following describes the relationship between a confidence interval for y at a given value of x and a prediction interval for y at the same value of x?
a. The confidence interval will be narrower than the prediction interval. b. The confidence interval will be always half the width of the prediction interval. c. The confidence interval will be wider than the prediction interval. d. The confidence interval will be the same width as the prediction interval.
Critics of industrial regulation say that such regulation:
A. benefits small firms at the expense of large firms. B. perpetuates monopoly long after new technology has eroded natural monopoly. C. creates insurmountable principal-agent problems. D. has resulted mainly from the paradox of voting.
The menu cost theory states that
A. prices depend only on the input costs. B. economic agents quickly learn the likely responses of the Fed to changes in unemployment. C. prices are not fully flexible because it is costly for firms to change prices every time there is a demand change. D. the economy is characterized by perfect competition.