Graph the function.f(x) = x2 + 
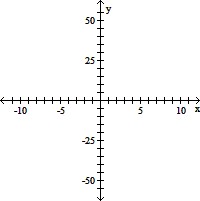
A. 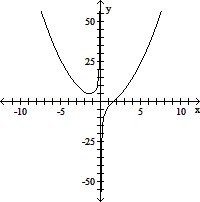
B. 
C. 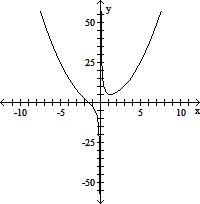
D. 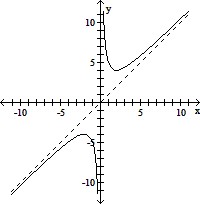
Answer: C
You might also like to view...
Find the absolute value.|-11|
A. -11 B. 0 C. ± 11 D. 11
Solve the problem.At one college, GPAs are normally distributed with a mean of 2.6 and a standard deviation of 0.6. What percentage of students at the college have a GPA between 2 and 3.2?
A. 47.5% B. 84% C. 95% D. 68%
Provide an appropriate response.A welder can make 8 welds in an hour. How many welds can 26 welders make in a 40-hour week if all work at the same rate?
A. 74 B. 130 C. 5,260 D. 8,320 E. none of the above
Solve the problem.It has been found that the less income people have, the more likely they are to report that their health is fair or poor. The function  models the percentage of Americans reporting fair or poor health, f(x), in terms of annual income, x, in thousands of dollars. Find and interpret f(24).
A. f(24) ? 16.4; 24% of Americans earning $16.4 thousand annually report fair or poor health. B. f(24) ? $17.4; 24% of Americans earning $17.4 thousand annually report fair or poor health. C. f(24) ? 17.4; 17.4% of Americans earning $24 thousand annually report fair or poor health. D. f(24) ? 16.4; 16.4% of Americans earning $24 thousand annually report fair or poor health.