Determine which region, I through VII, the indicated element belongs.The chart that follows shows people's loyalty to specific grocery stores. In the Venn diagram given, the set indicated as Year 1 represents the set of grocery stores listed in the table under Year 1, and so on.
 Sloan's
A. III
B. V
C. VI
D. VIII
Answer: B
Mathematics
You might also like to view...
Find the volume of the solid generated by revolving the region bounded by the given lines and curves about the  . y = 6x, y = 6, x = 0
A. 3? B. 12? C. 18? D. 24?
Mathematics
Construct a boxplot as requested.Here are the ages of the male and female employees at First River Bank. Draw a box plot for each of the two data sets.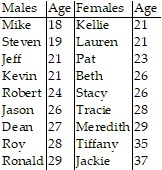
A. 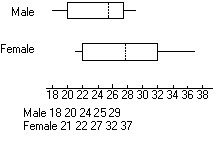
B. 
C. 
D. 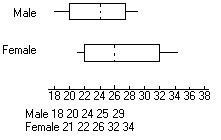
Mathematics
Solve the direct variation.If n varies directly as the square of m and n = 48 when m = 4, what is the value of n when m = -5?
A. -75 B. 60 C. -60 D. 75
Mathematics
Identify the unknown amount as the percent, part, or whole.50% of what number is 11?
A. percent B. part C. whole
Mathematics