Based on the graphic showing the Lorenz Curve, which of the following would represent the most equal income distribution?
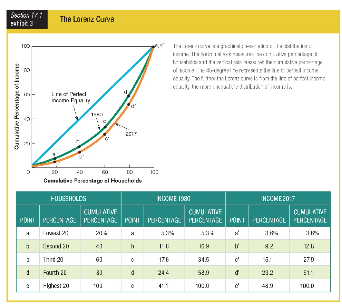
a. a straighter line to the left of the Lorenz curve for 1980
b. a line between the Lorenz curves for 1980 and 2017
c. a more curved line to the right of the Lorenz curve for 2017
d. a line that matched the Lorenz curve for 1980
a. a straighter line to the left of the Lorenz curve for 1980
You might also like to view...
The slope of a production possibilities frontier that displays increasing opportunity cost is
A) positive and constant. B) negative and constant. C) steeper near the horizontal intercept than near the vertical intercept. D) steeper near the vertical intercept than near the horizontal intercept.
A real option can present management with the opportunity to
A) vary output. B) abandon a project. C) postpone a project. D) All of the above
A shortage will occur when
A) the price equals the market clearing level. B) the price is above the market clearing level. C) there is an excess quantity supplied. D) the price is below the market clearing level.
A firm has a fixed cost of $2,000, and at an output of one, variable cost is $1,500. How much is marginal cost at an output of 1?
A. $1,000 B. $1,500 C. $2,000 D. $3,500