Plot and interpret the appropriate scatter diagram.The table gives the times spent watching TV and the grades of several students. 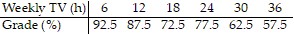 Effect of Watching TV on Grades
A. Effect of Watching TV on Grades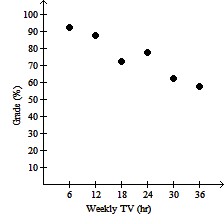
More hours spent watching TV may
increase grades.
B. Effect of Watching TV on Grades
More hours spent watching TV may
increase grades.
C. Effect of Watching TV on Grades
More hours spent watching TV may
reduce grades.
D. Effect of Watching TV on Grades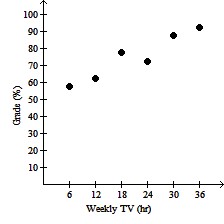
More hours spent watching TV may
reduce grades.
Answer: C
You might also like to view...
Find the average velocity of an object which follows the position function s(t) over the given interval.s(t) =  , [2, 8]
A. - 
B. 2
C. 7
D. 
Give the genus of the object.The letter T
A. Genus 1 B. Genus 0 C. Genus 2 D. Genus 3 or more
Change to the measure indicated.52.2 hectograms to kilograms
A. 5.22 kg B. 5,220 kg C. 52.2 kg D. 0.522 kg
Find the inverse of the function.f(x) = 
A. f-1(x) = 
B. f-1(x) = 
C. f-1(x) = 
D. f-1(x) = 