Plot the point and state the quadrant, if any, in which the point is located.(-4, -6)
A. Quadrant II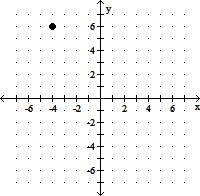
B. Quadrant III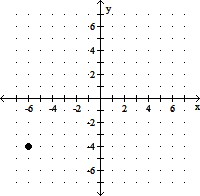
C. Quadrant III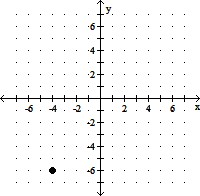
D. Quadrant IV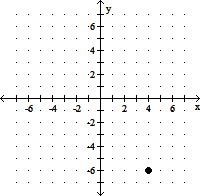
Answer: C
Mathematics
You might also like to view...
Use the bar graph, which shows the receipts of the federal government (in billions of dollars) for selected years from 1996 through 2006. In this exercise you are given the expenditures of the federal government. Find the magnitude of the surplus or deficit for the year 2006.
(Source: U.S. Office of Management and Budget)
?
 Year
Receipts
Expenditures
|Receipts - Expenditures|
?2006
?
?2655.4
?
?
Year
Receipts
Expenditures
|Receipts - Expenditures|
?2006
?
?2655.4
?
?
A. ?
| Year | Receipts | Expenditures | |Receipts - Expenditures| |
| ?2006 | ?2407.3 | ?2655.4 | ?248.1 |
B. ?
| Year | Receipts | Expenditures | |Receipts - Expenditures| |
| ?2006 | ?2407.3 | ?2655.4 | ?102.4 |
C. ?
| Year | Receipts | Expenditures | |Receipts - Expenditures| |
| ?2006 | ?2407.3 | ?2655.4 | ?105.4 |
D. ?
| Year | Receipts | Expenditures | |Receipts - Expenditures| |
| ?2006 | ?2407.3 | ?2655.4 | ?107.4 |
E. ?
| Year | Receipts | Expenditures | |Receipts - Expenditures| |
| ?2006 | ?2407.3 | ?2655.4 | ?107 |
Mathematics
Write a fraction to represent the shaded region.What part of the inch is highlighted? 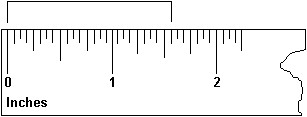
A. 
B. 
C. 
D. 
Mathematics
P(6 ? X ? 7); X is Normal (1, 4).
Find the probability for the given random variable.
Mathematics
Graph piecewise-defined function:
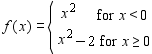
A. 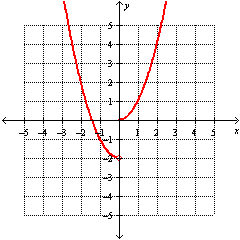
B. 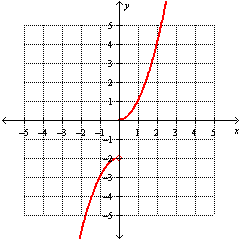
C. 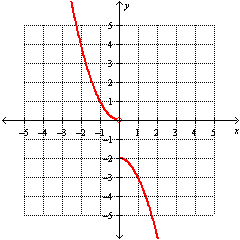
D. 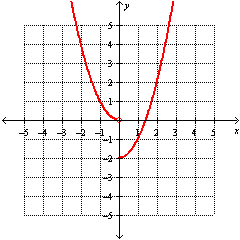
Mathematics