Figure 10-5
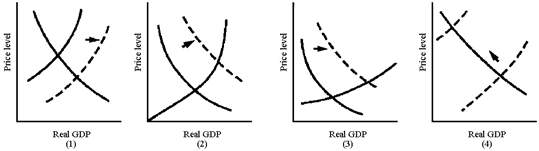
In Figure 10-5, which graph best illustrates the situation of an economy near full employment that experiences an increase in autonomous consumer spending?
a.
(1)
b.
(2)
c.
(3)
d.
(4)
b
You might also like to view...
The opportunity cost of owning and using a firm's capital is defined as the capital's
A) variable cost. B) fixed cost. C) economic depreciation. D) nonpayment depreciation. E) explicit cost.
If the CPI falls from 142 to 140 between two consecutive years, this implies that prices fell by 2% between those two years
Indicate whether the statement is true or false
Which of the following statements can correctly be made about social regulation? I. Extensive social regulation may have an anticompetitive effect. II. The benefits of social regulation are easier to measure than are the costs of social regulation
A) I only B) II only C) both I and II D) neither I nor II
An increase in the demand for a product will shift the
A. supply of labor used to produce the product rightward. B. supply of labor used to produce the product leftward. C. demand for labor used to produce the product rightward. D. demand for labor used to produce the product leftward.