According to Figure 6.1, in postwar U.S history ________
A) productivity growth was always exceeded by labor growth
B) labor growth has always exceeded capital growth
C) productivity growth has always exceeded capital growth
D) output growth has always exceeded productivity growth
D
You might also like to view...
A perfectly competitive firm in a constant-cost industry produces 3,000 units of a good at a total cost of $36,000. The prevailing market price is $15
What will happen to the number of firms in the industry and to the industry's output in the long run? A) The number of firms remains constant and the industry's output decreases. B) The number of firms and the industry's output increase. C) The number of firms remains constant and the industry's output increases. D) The number of firms and the industry's output decrease.
A call option has a strike price of $80. If the underlying stock is selling for $83 on the expiration date, the intrinsic value of the call option is __________ per share
A) $163 B) $83 C) $3 D) $0
GDP excludes expenditures by:
A. businesses on pollution control equipment. B. business for travel and entertainment. C. consumers on used automobiles. D. government on military hardware.
Refer to the information provided in Figure 2.4 below to answer the question(s) that follow.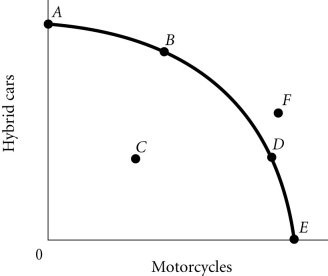 Figure 2.4Refer to Figure 2.4. The economy moves from Point A to Point D. This could be explained by
A. an increase in economic growth. B. a change in society's preferences for motorcycles versus hybrid cars. C. a reduction in unemployment. D. an improvement in technology.