Analyze the graph of the given function f as follows:(a) Determine the end behavior: find the power function that the graph of f resembles for large values of |x|.(b) Find the x- and y-intercepts of the graph.(c) Determine whether the graph crosses or touches the x-axis at each x-intercept.(d) Graph f using a graphing utility.(e) Use the graph to determine the local maxima and local minima, if any exist. Round turning points to two decimal places.(f) Use the information obtained in (a) - (e) to draw a complete graph of f by hand. Label all intercepts and turning points.(g) Find the domain of f. Use the graph to find the range of f.(h) Use the graph to determine where f is increasing and where f is decreasing.f(x) = x2(x + 2)
What will be an ideal response?
(a) For large values of |x|, the graph of f(x) will resemble the graph of y = x3.
(b) y-intercept: (0, 0), x-intercepts: (0, 0) and (-2, 0)
(c) The graph of f crosses the x-axis at (-2, 0) and touches the x-axis at (0, 0).
(e) Local minimum at (0, 0), Local maximum at (-1.33, 1.19)
(f) 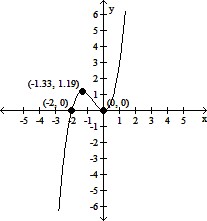
(g) Domain of f: all real numbers; range of f: all real numbers
(h) f is increasing on (-?, -1.33) and (0, ?); f is decreasing on (-1.33, 0)
You might also like to view...
Solve.x2 - x + 2 = 4x - 15
A.  ,
, 
B.  ,
, 
C.  ,
, 
D.  ,
, 
Find the velocity of a particle with the given position function.
 multiple choice.png)
Solve the problem.The graph below shows the height, in feet, of a ball thrown straight up with an initial speed of 96 feet per second from an initial height of 112 feet after t seconds.  At what time does the ball hit the ground? How do you know?
A. 1 second; 200 feet B. 7 seconds; height = 0 feet C. 6 seconds; 125 feet D. 5 seconds; 200 feet
The function  satisfies the hypotheses of the Mean Value Theorem on the interval [?2, 0]. Find all values of c that satisfy the conclusion of the theorem.
What will be an ideal response?