Make a line graph of the data.The following table shows the median teacher's salary in District X over several years. Use time on the horizontal scale for your line graph.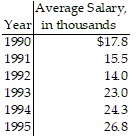
What will be an ideal response?
Answers may vary. The following is a possible answer.
Mathematics
You might also like to view...
Multiply by a fraction equivalent to 1 to build up the fraction to one with the denominator shown. =
= 
A. 
B. 
C. 
D. 
Mathematics
Estimate the sum or difference by first rounding each value to the indicated place value.55.017 - 1.8911 round each to the nearest one
A. 54 B. 53 .1 C. 53 .2 D. 53
Mathematics
Given the floor plan, determine whether a person could traverse through each unit by passing through each door only once.
A. Yes B. No
Mathematics
Find the circumference of a circle with radius 3 meters. Leave the answer in terms of p .
What will be an ideal response?
Mathematics