Use a graphing calculator to plot the data and find the quadratic function of best fit.An engineer collects data showing the speed s of a given car model and its average miles per gallon M. Use a graphing calculator to plot the scatter diagram. What is the quadratic function of best fit?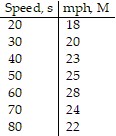
A. M(s) = 0.063x2 + 0.720x + 5.142
B. M(s) = -6.309x2 + 0.720x + 5.142
C. M(s) = -0.631x2 + 0.720x + 5.142
D. M(s) = -0.0063x2 + 0.720x + 5.142
Answer: D
Mathematics
You might also like to view...
Factor out the GCF from the polynomial.15m9 + 18m5 - 30m2
A. m2(15m7 + 18m3 - 30) B. 3m2(5m7 + 6m3 - 10) C. 3(5m9 + 6m5 - 10m2) D. -3m2(5m7 - 6m3 + 10)
Mathematics
What is the locus of the midpoints of the radii of  whose radius measures 4 inches?
What will be an ideal response?
Mathematics
Find f (c) by evaluating directly and by using synthetic division and the remainder theorem.f (x) = 4x4 - x3 - 9x2 + 5x - 10 and c = 5
A. 2,165 B. 2,150 C. -2,185 D. 2,175 E. 2,185
Mathematics
The graph of a function f is given. Determine whether f is continuous on its domain.
?
 ?
?
A. Continuous B. Discontinuous
Mathematics