The graph shows the monthly revenue in millions of dollars of a growing company after the company doubled its advertising. Use the graph to solve the problem. 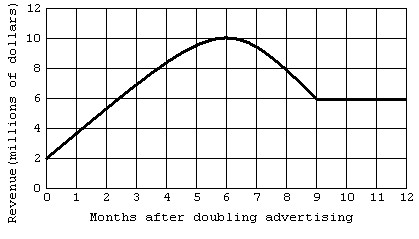 How many months after the company doubled its advertising did the minimum monthly revenue occur.
A. 6 months
B. 0 months
C. 12 months
D. 9 months
Answer: B
Mathematics
You might also like to view...
Use factoring techniques to solve the quadratic equation.3x2 - 21x + 30 = 0
A. {-2, -5} B. {2, 5} C. {3, 2, 5} D. {0, 2, 5}
Mathematics
Use the graph to find the indicated function value.y = f(x). Find f(-5)
A. 4.5 B. 11 C. 3.5 D. 0.5
Mathematics
Use the properties of limits to evaluate the limit if it exists.

A. 0
B. 2
C. Does not exist
D. 
Mathematics
Find the focus and directrix of the parabola with the given equation.y2 = 5x
A. Focus:  , directrix: x =
B. Focus:  , directrix: x = -
C. Focus:  , directrix: y = -
D. Focus: (5, 0), directrix: x = - 5
Mathematics