Explain the slope of your graph
The slope of the graph is a straight line indicating that the change in temperature is
directly proportional to the concentration.
You might also like to view...
Conversion of Units: A plot of land contains 5.8 acres. How many square meters does it contain? (1.0 acre = 43,560 ft2 and 2.54 cm = 1.00 in.)
A. 2.3 × 10⁴ m2 B. 7.1 × 10³ m2 C. 7.0 × 10⁴ m2 D. 5.0 × 10⁴ m2
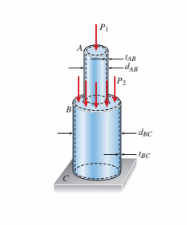
A hollow circular post ABC (see figure) supports a load P1 = 16 kN acting at the top. A second load P2 is uniformly distributed around the cap plate at B. The diameters and thicknesses of the upper and lower parts of the post are dAB = 30 mm, tAB = 12 mm, dBC = 60 mm, and tBC = 9 mm, respectively. The lower part of the post must have the same compressive stress as the upper part. The required magnitude of the load P2 is approximately:
(A) 18 kN
(B) 22 kN
(C) 28 kN
(D) 46 kN
In a telescopic observation of a field of stars, you see an irregularly-shaped dark patch. This is most likely
A. an area where there are no stars. B. a dark nebula. C. a black hole. D. the dusty center of a globular cluster.
On a scale where the distance from Earth to the Sun is about 15 meters, the distance from Earth to the Moon is
A) small enough to fit within your hand. B) about 1 meter. C) about 5 meters. D) about 30 meters.