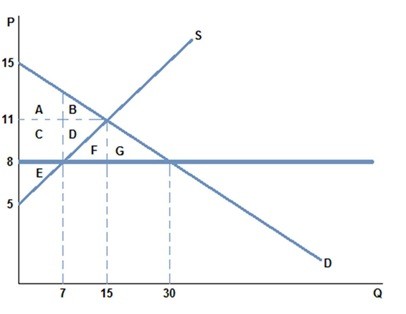
 The graph shown best represents:
A. a missing market.
B. a market for an inferior good.
C. a non-binding price ceiling.
D. a non-binding price floor.
Answer: D
You might also like to view...
Which of the following accounts for approximately three-fourths of all welfare spending?
a. the school lunch program b. the earned income tax credit c. unemployment compensation and workers' compensation combined d. "in-kind" transfers e. cash transfers
Which of the following people are liquidity providers?
A. Used car salesman B. Stock broker C. Real estate agent D. All of these are considered liquidity providers.
By being responsible for their actions
A) moral hazard becomes asymmetric information. B) employees are being given a property right. C) employees find it easier to free ride on the performance of others. D) the stock market is selling the claims of agents.
If a product has a diminishing, but positive, marginal utility, then total utility
A. increases at a diminishing rate. B. decreases at a diminishing rate. C. decreases at an increasing rate. D. will become negative.