A production possibilities curve shows the:
a. dollar costs of producing two different goods.
b. amounts of labor and capital needed to produce one good.
c. various combinations of goods that can be produced.
d. prices of different goods that are produced in an economy.
e. inefficient use of available resources and technology.
c
You might also like to view...
Efficiency wages:
A) can decrease costs if workers' productivity varies directly with wage rates. B) can be used to reduce wage rigidity. C) can lead to wage rigidity. D) can increase profits if productivity of workers is fixed.
A newly issued bond with a face value of $12,000 and no coupon payments is priced at $9,000 . The bond will mature in one year. What is the yield on this bond?
a. 33.3 percent b. 25 percent c. $3,000 d. $1,909.09 e. It depends on the interest rate
Look at the figure at right. A union wishes to maximize wage income for employed union? members, so it should aim for a wage rate? ________ and a number of employed members equal to
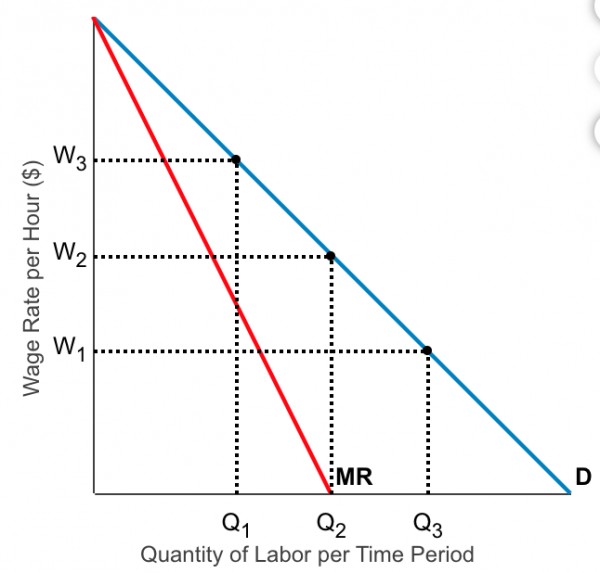
A. W3, Q3
B. W1, Q3
C. W3, Q1
D. W2, Q2
Table 34-4 ? Quantity Quantity Quantity Quantity ? Price per Demanded Supplied Demanded Supplied TV in United States in United States Japan Japan (dollars) (thousands) (thousands) (thousands) (thousands) 100 100 10 100 25 200 85 20 85 50 300 70 30 70 70 400 60 40 60 80 500 50 50 50 90 600 40 60 40 100 700 30 70 30 110 800 20 80 20 120 Table 34-4 presents the demand and supply schedules for television sets in Japan and the United States. If there is no trade between these countries, what are the equilibrium price and quantity in Japan?
A. P = $100, Q = 100 B. P = $200, Q = 85 C. P = $300, Q = 70 D. P = $400, Q = 60