The following figure shows the growth of a population as a function of time.
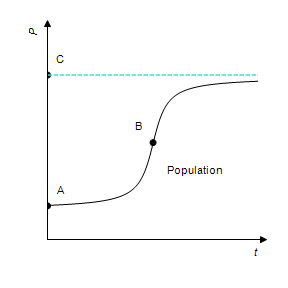
Which of A, B, and C correspond(s) to the point(s) at which the growth rate attains its maximum?
?
A. B
B. A
C. C
D. A and C
E. none of the above
Answer: A
Mathematics
You might also like to view...
Find the equation of the line specified.The line passes through the points (5, 5) and (6, 7)
A. y = 2x + 5 B. y = 2x - 5 C. y = 2x + 15 D. y = 4x - 5
Mathematics
Solve. Graph the solution on a number line, and express it in interval notation.12x + 9 > 3(3x - 3)![]()
A. x ? -6, (-?, -6]![]()
B. x < -6, (-?, -6)![]()
C. x > -6, (-6, ?)![]()
D. x ? -6, [-6, ?)![]()
Mathematics
Multiply.(-7.69)(-1.16)
A. 89.204 B. 0.089204 C. 8.9204 D. 0.89204
Mathematics
Evaluate to three decimal places.
 figure 1.png)
Mathematics