The following data give the dates of successive turning points in U.S. economic activity and the corresponding levels of real GDP at the time.Turning PointDateReal GDP(1996 $ billions) (A)Feb. 19612352.9(B)Dec. 19693571.4(C)Nov. 19703566.5(D)Nov. 19734151.1(E)Mar. 19754010.0Which of the following periods was an expansion?
A. November 1970 through November 1973
B. December 1969 through November 1973
C. November 1970 through March 1975
D. December 1969 through November 1970
Answer: A
You might also like to view...
Use the following table to answer the question below. Number of UnitsTotal Utility110021903270434054006450The addition of which unit has the greatest marginal utility?
A. first B. second C. fifth D. sixth
Which one of the following is the best example of an oligopolistic industry?
A. cigarettes B. wheat growers C. apple growers D. public utilities
In an aggregate expenditures diagram, a lump-sum tax (T) will:
A. not affect the C + I g + X n line. B. shift the C + I g + X n line upward by an amount equal to T. C. shift the C + I g + X n line downward by an amount equal to T. D. shift the C + I g + X n line downward by an amount equal to T × MPC.
Refer to the data. If the price in this market was $4:
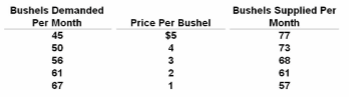
Answer the question on the basis of the given supply and demand data for wheat:
A. the market would clear; quantity demanded would equal quantity supplied.
B. buyers would want to purchase more wheat than is currently being supplied.
C. farmers would not be able to sell all their wheat.
D. there would be a shortage of wheat.