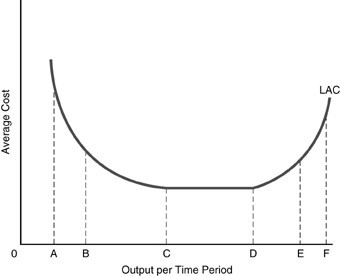
 In the above figure, the long-run cost curve between points A and B illustrates
A. diseconomies of scale.
B. diminishing marginal product.
C. constant returns to scale.
D. economies of scale.
Answer: D
You might also like to view...
Which of the following is TRUE?
A) When a market price allocates resources, everyone who is able to pay the price gets the resource. B) A command system works well when the lines of authority and responsibility are clear. C) When the government decides how to allocate tax dollars among competing uses, resources are allocated by command. D) When a manager offers everyone in the company the opportunity to win a prize, resources are allocated by a market price.
The wage rate paid by Walkman producers falls and at the same time the price of raw materials used in the production of Walkmans rises. You predict that the supply curve of Walkmans will
A) shift either leftward or rightward. B) surely shift rightward. C) surely shift leftward. D) surely become steeper.
People who hold well-diversified portfolios of stocks have greatly reduced or eliminated
a. firm-specific risk, and so they do not need to worry about their wealth decreasing as a result of recessions. b. market risk, and so they do not need to worry about their wealth decreasing as a result of recessions. c. firm-specific risk, but still they have reason to worry about their wealth decreasing as a result of recessions. d. market risk, but still they have reason to worry about their wealth decreasing as a result of recessions.
Between 1993 and 2001 the U.S. economy experienced
a. relatively low inflation and unemployment rates. b. relatively high inflation and unemployment rates. c. relatively low inflation rates and relatively high unemployment rates. d. relatively high inflation rates and relatively low unemployment rates.