Solve the problem.The table gives the number of basic cable TV subscribers (in millions) for a certain region for the years shown.  a. Write this data as a set of ordered pairs of the form (year, number of basic cable TV subscribers in millions).b. Create a scatter diagram of the data. Be sure to label the axes properly.
A. (2000, 0.2), (2001, 0.9), (2002, 0.7), (2003, 1.4), (2004, 1.7), (2005, 1.2)
B. (0.2, 2000), (0.9, 2001), (0.7, 2002), (1.4, 2003), (1.7, 2004), (1.2, 2005)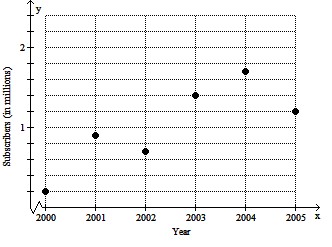
Answer: A
You might also like to view...
Compute the definite integral as the limit of Riemann sums. dx
dx
A. 
B. 
C. 0
D. 27
Suppose that the functions f and g and their derivatives with respect to x have the following values at the given values of x. Find the derivative with respect to x of the given combination at the given value of x.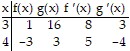 f2(x) ? g(x), x = 3
A. 48 B. 35 C. 131 D. 259
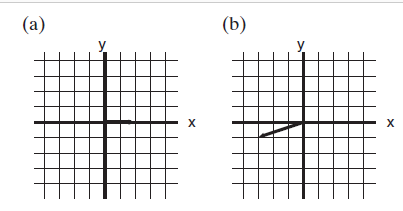
If A has coordinates (4, 3) and B has coordinates (-1,-5), what are the coordinates of A' and B' under the translations shown below.
Factor completely, or state that the polynomial is prime.250x5 - 16x2
A. 2x2(5x - 2)(25x2 + 10x + 4) B. 2x2(5x - 2)(25x2 - 10x + 4) C. 2x2(5x + 2)(25x2 - 10x + 4) D. Prime