Plot and interpret the appropriate scatter diagram.The one-day temperatures for 12 world cities along with their latitudes are shown in the table below. Make a scatter diagram for the data. Describe what happens to the one-day temperatures as the latitude increases. Latitude (degrees)
 Temperature (F)°
What will be an ideal response?
Latitude (degrees)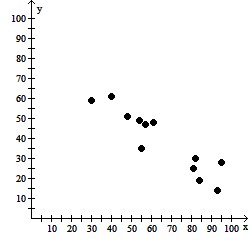
Temperature (F)°
As the latitude increases, the one-day temperatures decrease.
You might also like to view...
Solve the problem.How many 3-digit numbers can be formed using the digits 0, 1, 2, 3, 4, 5, 6, 7, 8, 9, if repeated digits are allowed and the first digit may not be a 0?
A. 1000 B. 899 C. 900 D. 27
Use a graphing calculator to determine which expression completes the identity.The expression  is to be the left hand side of an equation that is an identity. Which one of the following four expressions can be used as the right hand side of the equation to complete the identity?
A. csc x cot x B. sec x cot x C. tan2 x- 1 D. cos x sin x
Verify that the values of the variables listed are solutions of the system of equations. x = 6, y = -2
A. solution B. not a solution
Solve the problem.If a graph is symmetric with respect to the y-axis and it contains the point (5, -6), which of the following points is also on the graph?
A. (5, -6) B. (-6, 5) C. (-5, 6) D. (-5, -6)