Refer to the diagram. A shift of the aggregate demand curve from AD 1 to AD 0 might be caused by a(n):
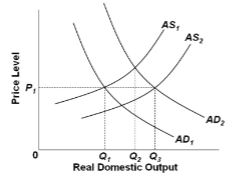
A. decrease in aggregate supply.
B. decrease in the amount of output supplied.
C. increase in investment spending.
D. decrease in net export spending.
C. increase in investment spending.
You might also like to view...
What role do losses play in a competitive price-searcher market?
a. They penalize a firm for producing a differentiated product. b. They signal that more resources are needed in a particular market. c. They show firms that barriers to entry are high. d. They send a message that more value would be created if the resources were used to produce other goods.
According to a 2009 article in The Economist, the multiplier effect and crowding-out effect would exactly offset each other when the economy is
a. operating at full capacity. b. in recession. c. experiencing zero inflation. d. experiencing high rates of inflation.
Refer to the information provided in Table 23.7 below to answer the question(s) that follow. Table 23.7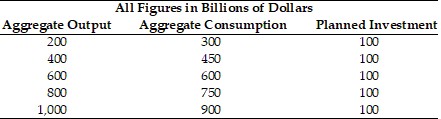 Refer to Table 23.7. Which of the following statements is false?
A. If aggregate output equals $1000 billion, then aggregate saving equals $100. B. The MPC for this economy is 0.75. C. At an output level of $400 billion, there is a $150 billion unplanned inventory decrease. D. At output levels greater than $800 billion, there is a positive unplanned inventory change.
Least squares estimates are the estimates that correspond to the smallest sum of the squared distances, or errors.
Answer the following statement true (T) or false (F)