Provide an appropriate response.Explain how the graph of f(x) = ln x could be used to graph the function g(x) = ex - 1.
What will be an ideal response?
Reflect the graph of f(x) = ln x across the line y = x and then translate it to the right one unit.
You might also like to view...
Solve the system by graphing.3x - 2y = 4-6x + 4y = 7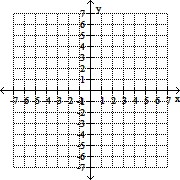
A. (1, 2) B. (2, 1) C. Dependent D. Inconsistent
Solve using both the addition and multiplication properties of equality.5m - 6 = 3m - 10
A. m = -5 B. m = 5 C. m = -2 D. m = 2
Give the coordinates of the points shown on the graph. 
A. G = (7, 3), H = (-6, 3) B. G = (7, -6), H = (3, -6) C. G = (-6, 7), H = (3, -6) D. G = (7, -6), H = (-6, 3)
The numbers of eggs E (in billions) produced in the United States from 1990 through 2006 can be modeled by
?
 ?
where t represents the year, with ?t =?0 corresponding to 1990.
If this relationship between salary and time continues, when was the annual egg production 70 billion, but no more than 99 billion?
(Round the answer to two decimal places.)
?
?
where t represents the year, with ?t =?0 corresponding to 1990.
If this relationship between salary and time continues, when was the annual egg production 70 billion, but no more than 99 billion?
(Round the answer to two decimal places.)
?
A. 3.32 ? t ? 22.39; Between 1993 and 2012 B. 2.32 ? t ? 21.39; Between 1992 and 2011 C. 4.32 ? t ? 23.39; Between 1994 and 2013 D. 5.32 ? t ? 24.39; Between 1995 and 2014 E. 1.32 ? t ? 20.39; Between 1991 and 2010