The diagram below shows the general equilibrium model for X and Y for a small hypothetical economy. Point A in this diagram represents positions where 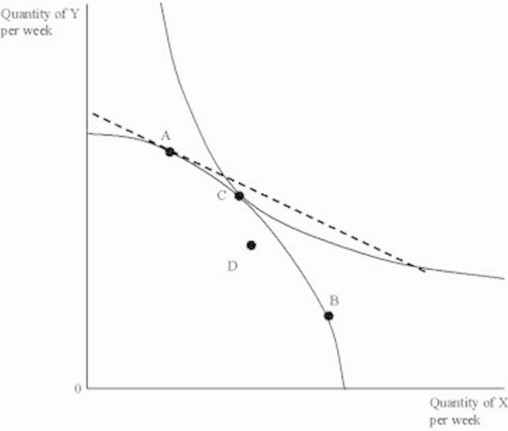
A. the economy is at an economically efficient allocation of resources.
B. there is an excess demand for good X.
C. good Y costs less to produce than its production cost at point C.
D. there is an excess supply of good X.
Answer: B
You might also like to view...
Which of the following directs the buying and selling of U.S. government securities?
a. Board of Governors. b. Federal Reserve Banks. c. Federal Open Market Committee. d. Federal Advisory Council. e. Member banks.
Diminishing marginal returns means that aggregate production function is
a. linear b. downward sloping c. upward sloping d. concave e. convex
The multiplier is increased when income taxes are included
a. True b. False Indicate whether the statement is true or false
If a supply curve shifts rightward, this means
A) suppliers are willing and able to offer less of the good for sale at every price. B) suppliers are willing and able to offer more of the good for sale at every price. C) quantity supplied is greater at every price. D) suppliers are willing and able to offer more of the good for sale only at a particular price. E) b and c