Analyze the graph of the given function f as follows:(a) Determine the end behavior: find the power function that the graph of f resembles for large values of |x|.(b) Find the x- and y-intercepts of the graph.(c) Determine whether the graph crosses or touches the x-axis at each x-intercept.(d) Graph f using a graphing utility.(e) Use the graph to determine the local maxima and local minima, if any exist. Round turning points to two decimal places.(f) Use the information obtained in (a) - (e) to draw a complete graph of f by hand. Label all intercepts and turning points.(g) Find the domain of f. Use the graph to find the range of f.(h) Use the graph to determine where f is increasing and where f is decreasing.f(x) = -x2(x - 1)(x + 3)
What will be an ideal response?
(a) For large values of |x|, the graph of f(x) will resemble the graph of y = -x4.
(b) y-intercept: (0, 0), x-intercepts: (-3, 0) , (0, 0), and (1, 0)
(c) The graph of f crosses the x-axis at (1, 0) and (-3, 0) and touches the x-axis at (0, 0).
(e) Local maxima at (-2.19, 12.39) and (0.69, 0.55); Local minimum at (0, 0)
(f) 
(g) Domain of f: all real numbers; range of f: (-?, 12.39]
(h) f is increasing on (-?, -2.19) and (0, 0.69); f is decreasing on (-2.19, 0) and (0.69, ?)
You might also like to view...
Evaluate the function.p(x) = 1 +  ; p(42)
A. 6 B. 37 C. 36 D. 7
Use the circle graph to solve the problem.The circle graph shows the percent of the total population of 93,700 of Springfield living in the given types of housing.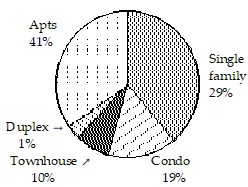 Find the number of people who live in single family houses. Round your result to the nearest whole number.
A. 27,173 people B. 31,858 people C. 29 people D. 66,527 people
Find the exact value of the following expression without using a calculator.cos 
A. 
B. 
C. - 
D. - 
Factor the difference of two squares completely.x2y2 - 4
A. (xy - 2)2 B. (x + 2y)(x - 2y) C. (xy + 2)(xy - 2) D. Prime