Make a bar graph using the given frequencies.The frequency distribution indicates the test averages of a group of 336 students.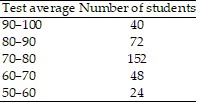
A. 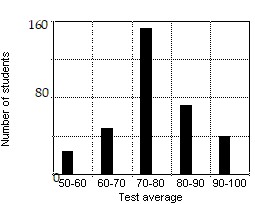
B. 
C. 
D. 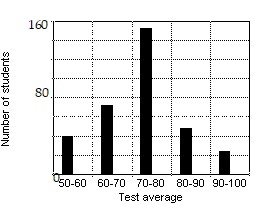
Answer: A
Mathematics
You might also like to view...
Let L be the value of  f(x). Use graphical methods, and the additional information provided, to find a
  so that if
  then
then  Let f(x) = x2 + 2, x0 = 2, L = 6, and ? = 1.0
A. 4 B. 0.2 C. 0.5 D. 0.24
Mathematics
Find the exact value under the given conditions.sin ? =  , 0 < ? <
  ; cos ? =
  , 0 < ? <
  Find cos (? + ?).
A. 
B. 
C. 
D. 
Mathematics
Determine whether the sequence is arithmetic. If the sequence is arithmetic, determine the first term a and common difference d.2, 4, 6, 10, 12, . . .
A. Arithmetic; a = 2, d = 2 B. Not arithmetic
Mathematics
Find the y-intercepts and any x-intercepts.y = x2 + 4x + 8
A. y-intercept (0, 8), no x-intercepts B. no y-intercept, no x-intercept C. y-intercept (0, 8), x-intercept (-4, 0) D. y-intercept (0, 8), x-intercept (2, 0)
Mathematics