In the graph showing the market for loanable funds, at the real interest rate, the demand for loanable funds______.
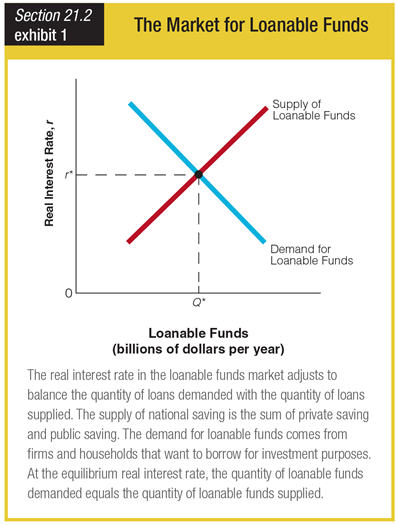
a. is greater than the supply of loanable funds
b. is less than the supply of loanable funds
c. equals the supply of loanable funds
d. is at its furthest point from the supply of loanable funds
c. equals the supply of loanable funds
You might also like to view...
Kyle and Stan are playing Odds or Evens, where Kyle is designated as the "odd" player and Stan is designated as the "even" player. They decide to play the game 10 times. Stan's ideal mixture is to
A) "shoot 1" every time since Kyle is the "odd" player. B) "shoot 2" every time since he is the "even" player. C) "shoot 1" 50% of the time and "shoot 2" 50% of the time. D) Stan's ideal mixture depends on Kyle's ideal mixture.
Which of the following sets of outcomes is exhaustive?
A) win, lose, tie B) employed full-time, employed part-time, unemployed C) married, single, widowed D) All of the above.
Suppose the accompanying figure shows the demand curve, marginal revenue curve and marginal cost curve for a monopolist.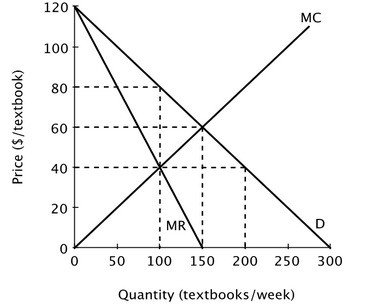 At this monopolist's profit-maximizing level of output, deadweight loss equals ________.
A. $2,000 B. $1,000 C. $6,000 D. $4,000
Suppose Mary receives an $8,000 loan from First National Bank. Mary repays $8,480 to First National Bank at the end of one year. Assuming the simple calculation of interest, the interest rate on Mary's loan was:
A. $480 B. 8.00% C. 6.00% D. 5.66%