First, create a scatter plot for the data in the table. Then, use the shape of the scatter plot given to determine if the data are best modeled by a linear function, an exponential function, a logarithmic function, or a quadratic function.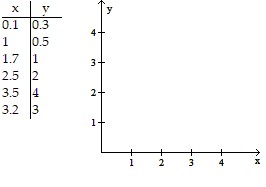
A. 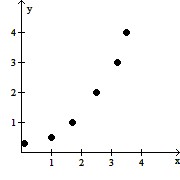
exponential function
B. 
quadratic function
C. 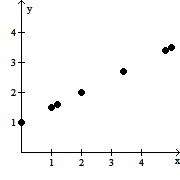
linear function
D. 
logarithmic function
Answer: A
Mathematics
You might also like to view...
Graph the inequality.2x + 5y ? -10
A. 
B. 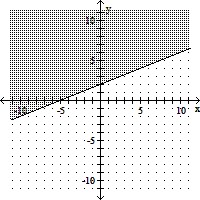
C. 
D. 
Mathematics
Determine whether the equation is an identity, a conditional equation, or an inconsistent equation.-4x + 6(-2x - 3) = -28 - 6x
A. Identity B. Conditional equation C. Inconsistent equation
Mathematics
Show that the matrix has no inverse.A = 
What will be an ideal response?
Mathematics
Solve.The FDA approves a new drug and has confirmed by independent research that the strength of the reaction to the drug is given by the formula 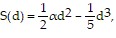 where d is the dosage amount of the drug and ? is a constant. Find an equivalent expression for S(d) by factoring out a common factor.
A.  (? - d)
B. d2
C. d2
D. 

Mathematics