Compared with curve 2 on this hydrograph, what is a possible explanation for curve 1? 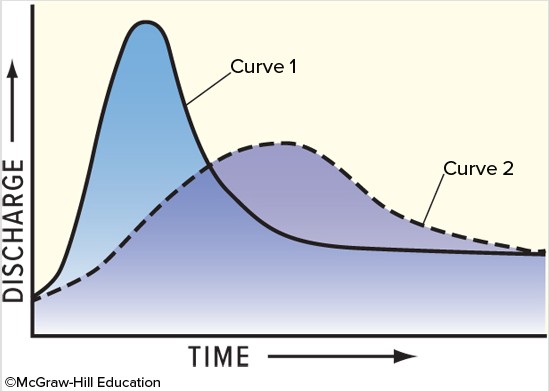
A. Curve 1 shows the same area as curve 2 but after urbanization.
B. The storm recorded by curve 1 was shorter and more intense than the storm represented by curve 2.
C. The basin for curve 1 has steeper slopes than the basin for curve 2.
D. All of these are possible.
Answer: D
You might also like to view...
How can a half-life be used to tell the age of a sample?
A. The ratio between the radioactive form and stable form varies regularly with time. B. The amount of radioactive form depends on the amount of radiation in the surroundings. C. The half-life of an isotope is constant. D. The ratio between the radioactive form and the stable form depends on the archaeological record. E. both C and D
An alluvial terrace is evidence of aggradation
Indicate whether the statement is true or false
Sunspots numbers cycle roughly every ____________________ years
Fill in the blank(s) with correct word
________ proposed an explanation for magnetic anomalies.
A. Vine and Matthews B. Charles Plummer C. Diane Carlson D. Harry Hess E. Alfred Wegener