Consider a consumer who consumes only  and
and  . The price of
  falls.
a. On a graph
with  on the horizontal and
  on the vertical axis, illustrate the change in this consumer's budget constraint assuming exogenous income I.
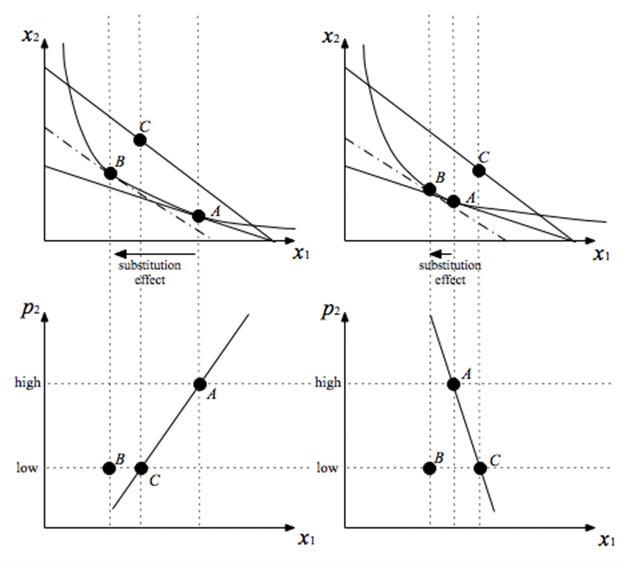
b. Illustrate income and substitution effects for  assuming that both goods are normal.
c. Can you tell whether the cross-price demand curve for  is upward or downward sloping?
d. Suppose  is leisure hours and
  is a composite consumption good. Consider an increase in the wage assuming a fixed endowment of leisure (and no exogenous source of income). How is your graph similar and how is it different from what you graphed in (a) through (c)?
e. Is the leisure-demand curve a cross-price demand curve? Why or why not?
What will be an ideal response?
b. The substitution effect is indicated in each of the top panels --- the income effect points in the opposite direction. On the vertical axis, the income effect implies C must lie above B.
c. No -- it depends on how large the substitution effect is relative to the income effect (as shown in the graphs).
d. The top graphs would be identical. But the bottom graphs are not -- because the wage appears on the vertical axis, and the wage is not the same as the price of consumption.
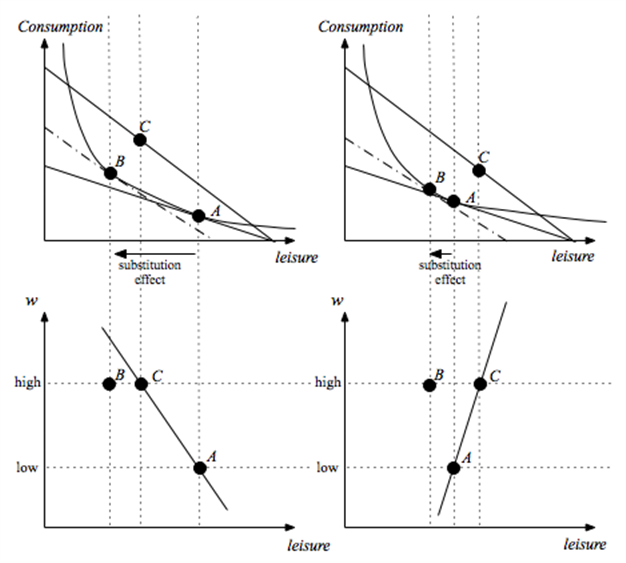
e. Not quite. The wage is not the price of consumption -- the good on the vertical axis in the top panels. Rather, the wage is the price of leisure. The models differ in that there is an exogenous income in the first case and an endogenous budget (derived from the leisure endowment) in the second case. But, when viewed as if the leisure demand curve arose from a model with exogenous income, an increase in the wage looks like a decrease in the price of consumption.
You might also like to view...
The natural rate of unemployment is comprised of
A) frictional and cyclical unemployment. B) frictional and structural unemployment. C) cyclical and structural unemployment. D) frictional, cyclical, and structural unemployment.
A price ceiling is binding when it is set
a. above the equilibrium price, causing a shortage. b. above the equilibrium price, causing a surplus. c. below the equilibrium price, causing a shortage. d. below the equilibrium price, causing a surplus.
The government imposes a $2.50 per-unit tax on the production of good X. As a result the
A) supply curve for good X shifts leftward and the price of good X rises. B) quantity supplied of good X falls and the price of good X rises. C) demand curve for good X shifts leftward and the price of good X falls. D) supply curve for good X shifts rightward and the price of good X falls. E) supply curve for good X shifts leftward and the price of good X falls.
If the short-run price elasticity of demand for hospital care is .27, then the long-run price elasticity is expected to be:
A. greater than .27. B. perfectly inelastic. C. less than .27. D. equal to .27.