Graph the linear function by plotting the x- and y-intercepts.-  x + y - 3 = 0
A. intercepts: (0, 3), (6, 0)
B. intercepts: (0, 3), (-3, 0)
C. intercepts: (0, -6), (6, 0)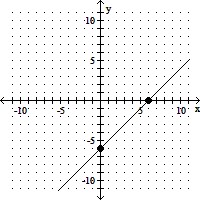
D. intercepts: (0, 3), (-6, 0)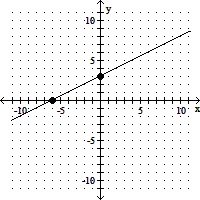
Answer: D
You might also like to view...
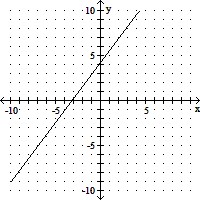
Write the English sentence as an equation in two variables. Then graph the equation.The y-value is six less than twice the x-value.
A. y = x + 6
B. y = 2x - 6
C. y = x - 6
D. y = 2x + 6
A survey showed that students had these preferences for instructional materials. Use the graph to answer the question. About how many students would you expect to prefer radio in a school of 650 students?
A. About 33 students B. About 5 students C. About 117 students D. About 234 students
Find the measure of the angle. ?WZV
?WZV
A. 90° B. 25° C. 15° D. 30°
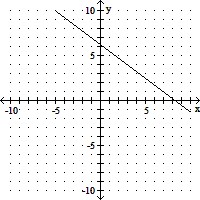
Find the slope and the y-intercept from the equation of the line. Sketch a graph of the equation.-4y = -3x - 25
A. m =  ; y-intercept =

B. m = -  ; y-intercept =
C. m =  ; y-intercept =
D. m = -  ; y-intercept =
