The bar graph shows the number of new residents in several towns during the years 1999 to 2001. Use the graph to answer the question. 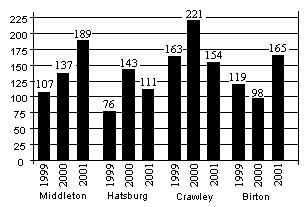 In the year 2000, which town had the smallest number of new residents?
A. Middleton
B. Crawley
C. Hatsburg
D. Birton
Answer: D
Mathematics
You might also like to view...
Solve the problem.Find the image of rectangle ABCD for the size transformation with center O and scale factor 2/3.
A. 
B. 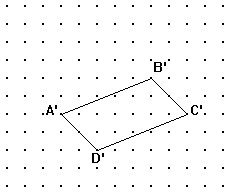
C. 
D. 
Mathematics
Draw and shade a Venn diagram that corresponds to the set. ?
? 

A. 
B. 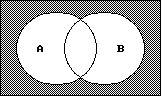
Mathematics
Solve the problem. Round rates to the nearest tenth of a percent and dollar amounts to the nearest cent.A jewelry store purchased 80 fashion watches for $2400. If the store sold 40 watches at $60, 32 watches at $54, and the rest at $30, find (a) the total markup, (b) the markup percent on selling price, and (c) the equivalent markup percent on cost.
A. $1968, 45.1%, 82% B. $1968, 82%, 45.1% C. $2400, 55%, 72% D. $4368, 100%, 182%
Mathematics
Find the domain of the rational function.f(x) = 
A. 
B. 
C. 
D. 
Mathematics