Add.84 + -130
A. 
B. 
C. 214
D. 46
Answer: B
You might also like to view...
Use a grapher to graph the function.Two signals are seen on an oscilloscope as being at right angles. The equations for the displacement of these signals are  Graph the figure that appears on the oscilloscope.
A. 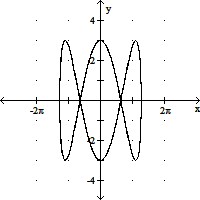
B. 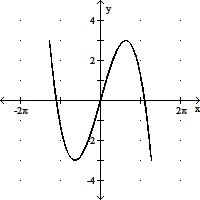
C. 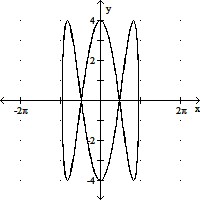
D. 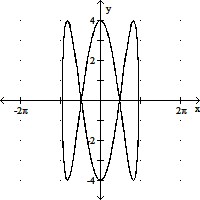
Provide an appropriate response.Solve, checking for extraneous roots:  = 0
= 0
A. x = -4 B. x = 0, x = -4 C. x = -4, x = -3 D. x = 0
Write an inequality involving the variable x that describes the set of numbers graphed.![]()
A. x > 3 B. x ? 3 C. x ? 3 D. x < 3
Solve the problem.The following graph approximates the number C, in thousands, of cars sold that were manufactured in the U.S. since 1983. The equation of this graph is given by C = -1.63t4 + 49.5t3 - 476t2 + 1370t + 6705 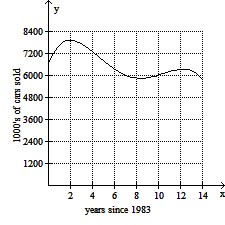 Use the graph to approximate the domain and range of the function.
A. Domain: [5900, 7900], Range: [0, 14] B. Domain: [0, 14], Range: [5900, 7900] C. Domain: [0, ?), Range: [5900, 7900] D. Domain: [0, 14], Range: [0, 7300]