Solve the problem.Suppose that the speed of a car, measured in miles per hour (mph), is monitored for some short period of time after the driver applies the brakes. The following table relates the speed of the car to the amount of time, measured in seconds (sec), elapsed from the moment that the brakes are applied.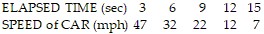 Represent the data in the table graphically with elapsed time on the horizontal axis and speed on the vertical axis. What general trend do the data reflect?
A. There is no apparent trend in the data.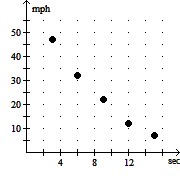
B. With increasing elapsed time,
the speed increases.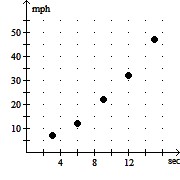
C. With increasing elapsed time,
the speed increases.
D. With increasing elapsed time,
the speed decreases.
Answer: D
You might also like to view...
Use Euler's method to calculate the first three approximations to the given initial value problem for the specified increment size. Round your results to four decimal places.y' = y - ex - 1, y(1) = 1, dx = 0.5
A. y1 = -0.5591, y2 = -3.6796, y3 = -9.1939 B. y1 = -0.3591, y2 = -3.2796, y3 = -9.1139 C. y1 = -0.1591, y2 = -2.8796, y3 = -9.0339 D. y1 = 0.0409, y2 = -2.4796, y3 = -8.9539
Find the infinite sum accurate to three decimal places.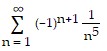
A. 1.036 B. 0.972 C. -0.972 D. -1.036
Use dot mode to graph the function f in the standard viewing rectangle. Evaluate f for the given x-values.f(x) = [[-x]] at x = -3.3 and x = 2.6
A. 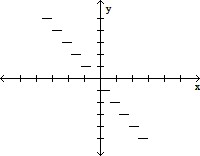
f(-3.3) = 1, f(2.6) = -3
B. 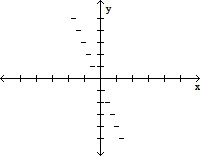
f(-3.3) = 2, f(2.6) = -1
C. 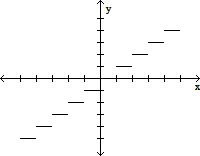
f(-3.3) = -4, f(2.6) = 2
D. 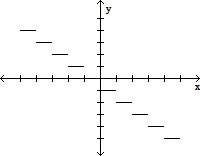
f(-3.3) = 3, f(2.6) = -3
Write the number in scientific notation.2,800,000
A. 2.8 × 10⁻⁶ B. 2.8 × 10⁵ C. 2.8 × 10⁻⁵ D. 2.8 × 10⁶