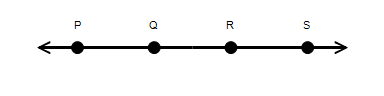
Use the illustration in the figure below to draw the figure  .
.
?
?
A. 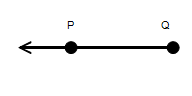
B. 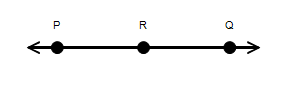
C. 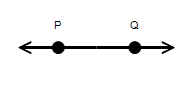
D. 
E. 
Answer: C
You might also like to view...
Decide whether a linear function, a quadratic function, or neither of these types of functions would be reasonable for modeling the data shown in the table. The table shows the population of a town in various years. 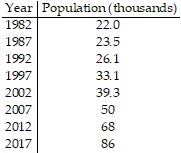
A. quadratic B. linear C. neither of these
Find the exact value of the expression.
A. - 
B. 
C. 
D. -
For the given direct statement, write the indicated related statement (converse, inverse, or contrapositive).If you like me, then I like you. (converse)
A. If I don't like you, then you don't like me. B. I like you if you don't like me. C. If I like you, then you like me. D. If you don't like me, then I don't like you.
Solve the problem.Let the demand and supply functions be represented by D(p) and S(p), where p is the price in dollars. Find the equilibrium price and equilibrium quantity for the given functions.D(p) = 2340 - 80pS(p) = 100p
A. $23; 500 B. $20; 1300 C. $13; 1300 D. $20; 740