Refer to the information provided in Figure 1.5 below to answer the question(s) that follow.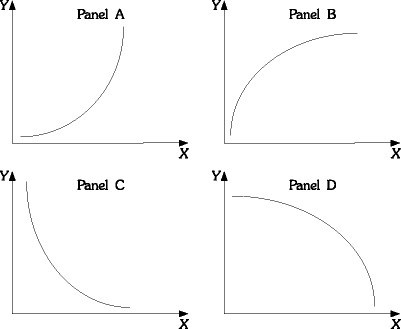 Figure 1.5Refer to Figure 1.5. As income increases, consumption increases, but for each additional increase in income, consumption increases by a larger and larger amount. If consumption is graphed on the vertical axis and income is graphed on the horizontal axis, the relationship between consumption and income would look like which of the following Panels?
A. A
B. B
C. C
D. D
Answer: A
You might also like to view...
The main function of the 1997 Stability and Growth Pact (SGP) was to
A) exclude a highly indebted EMU country B) enhance cooperation between France and Germany. C) make the Euro a weak currency. D) distribute the Euro banknote among European central banks and to create a timetable for the imposition of financial penalties on countries that fail to correct situations of "excessive" deficits and debt promptly enough. E) determine specialized penalties for each member nation.
which of the following contributed to the soaring housing prices of 2002-2005
What will be an ideal response?
If a positive permanent supply shock were to occur, the resulting equilibrium would be a:
A. higher level of output at lower prices. B. lower level of output and prices. C. higher level of output and prices. D. lower level of output at higher prices.
According to a Classical, sound finance perspective on macroeconomics, if an economy is on an inflationary path, the government should run:
A. a budget deficit and increase spending, which will reduce output. B. neither a surplus nor a deficit since changes in deficit spending do not affect output. C. a budget surplus and decrease spending, which will reduce output. D. neither a surplus nor a deficit since changes in spending affect output.